Please provide 200 Exponential moving average daily timeframe python code.
This is the formal way to approach the solution.
- Data Fetching:
- You can adjust the symbol, start date, and end date.
- 200 EMA Calculation:
- The
talib.EMAfunction calculates the Exponential Moving Average for theCloseprices over a specified period (200 days).
- The
- Output:
- The resulting DataFrame includes the 200 EMA values as a new column (
EMA_200).
- The resulting DataFrame includes the 200 EMA values as a new column (
import pandas as pd
import numpy as np
import talibStep 1: Fetch historical data (more than 250 candles)
def get_historical_data(symbol, start_date, end_date):
data = download(symbol, start=start_date, end=end_date)
return dataStep 2: Calculate 200 EMA
def calculate_ema(data, period=200):
# Ensure the Close column exists
if ‘Close’ not in data.columns:
raise ValueError(“Data must have a ‘Close’ column.”)# Calculate 200 EMA using TA-Lib data[f'EMA_{period}'] = talib.EMA(data['Close'], timeperiod=period) return dataStep 3: Main function to execute the steps
# Fetch historical data
data = get_historical_data(symbol, start_date, end_date)

# Ensure we have more than 250 candles
if len(data) < 250:
    raise ValueError("Not enough data to calculate the 200 EMA. Provide more historical data.")

# Calculate 200 EMA
data = calculate_ema(data, period=200)

# Print the latest data with EMA
print(data.tail())
Hi @Saurabh
we have applied 200 ema on Nifty and it seems to be working fine.
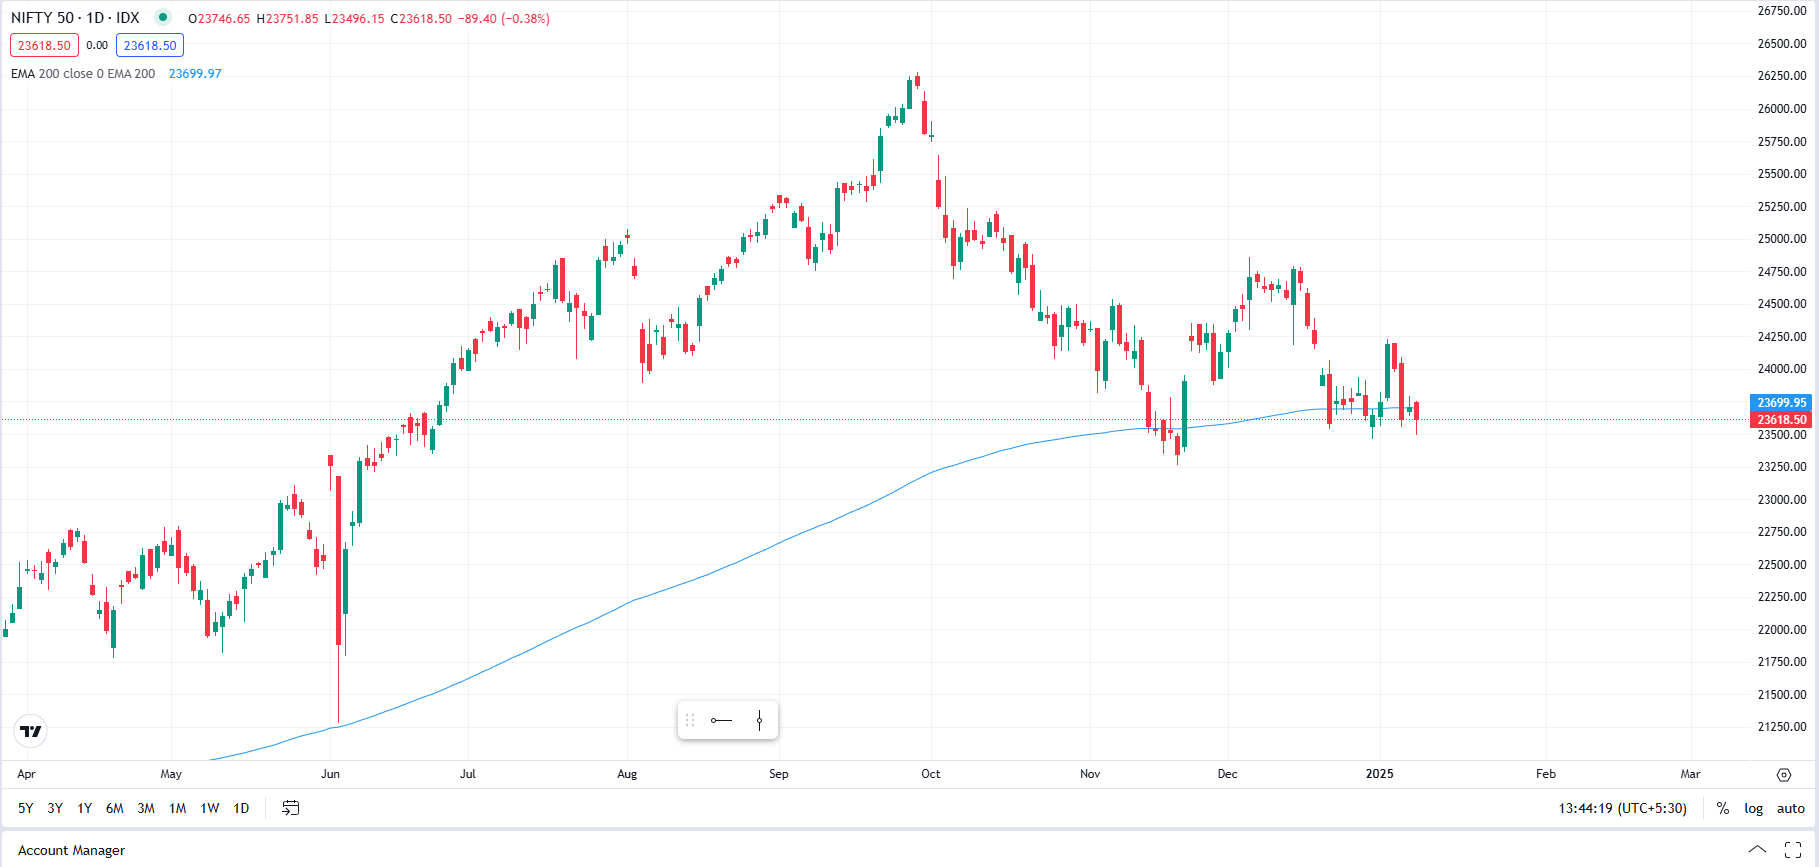
used 1500 in from date
in Dhan_Tradehull > get_historical_data > from_date= datetime.datetime.now()-datetime.timedelta(days=1500)
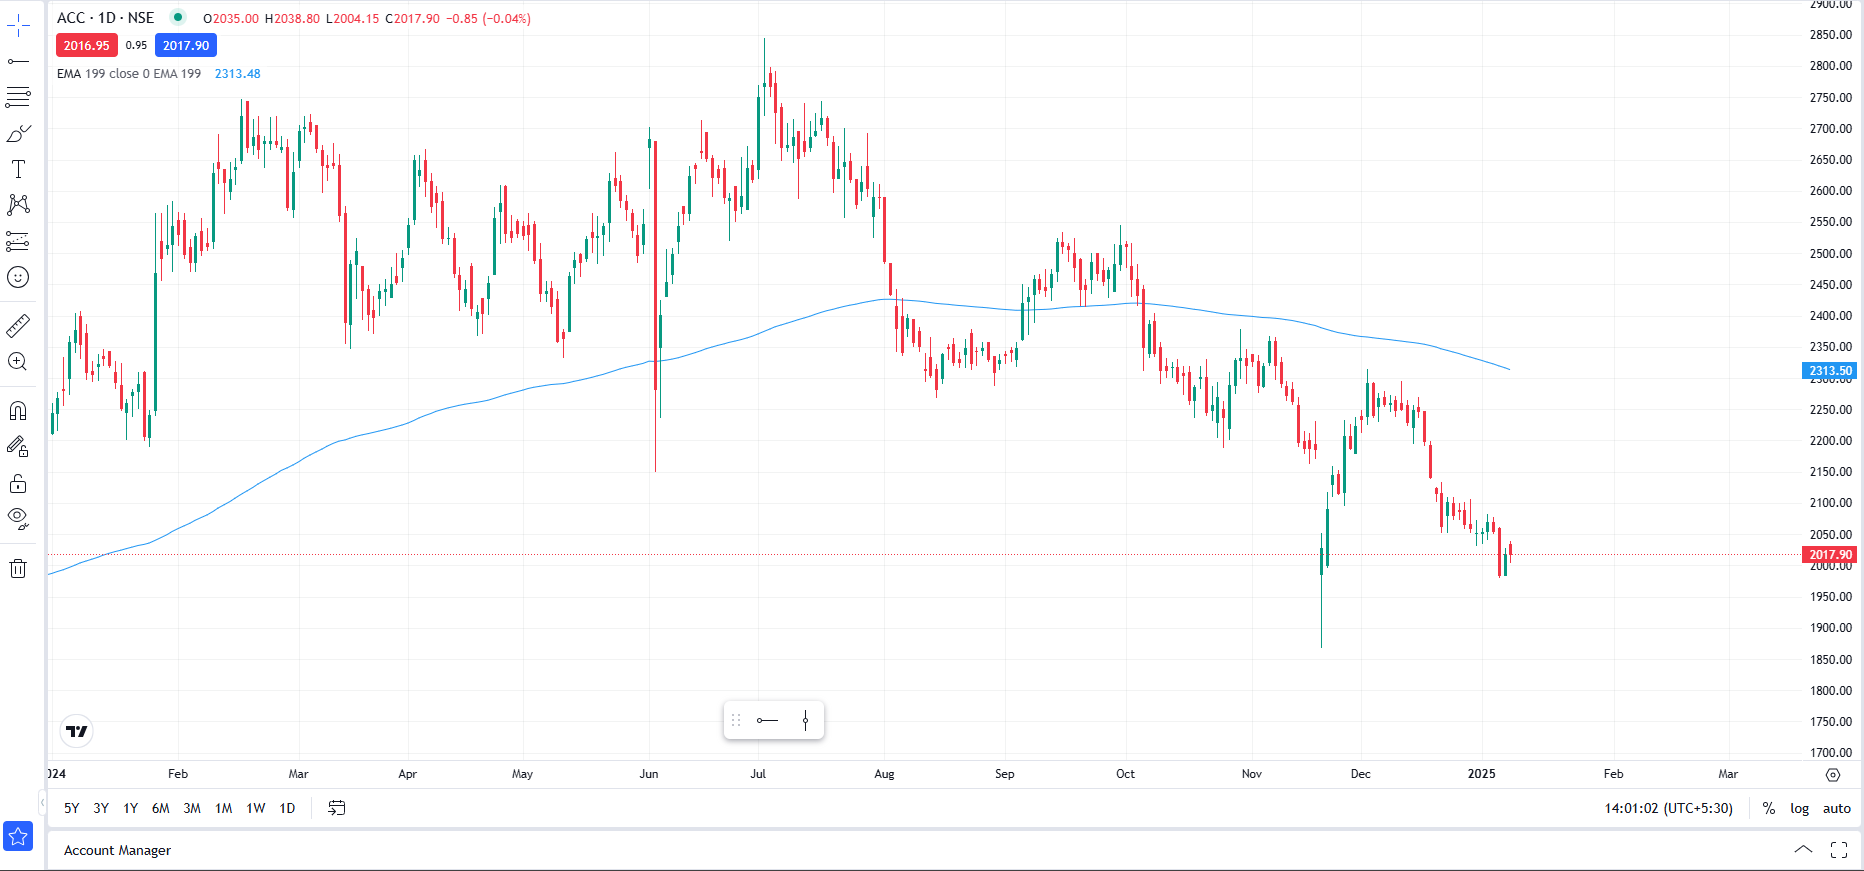
Also its matching for stocks also
example : ACC
code used
chart = tsl.get_historical_data(tradingsymbol = ‘NIFTY’,exchange = ‘INDEX’,timeframe=“DAY”)
chart[‘200_EMA’] = talib.EMA(chart[‘close’], timeperiod=200)
chart = tsl.get_historical_data(tradingsymbol = ‘ACC’,exchange = ‘NSE’,timeframe=“DAY”)
chart[‘200_EMA’] = talib.EMA(chart[‘close’], timeperiod=200)
Let me know if its also solved on your end also
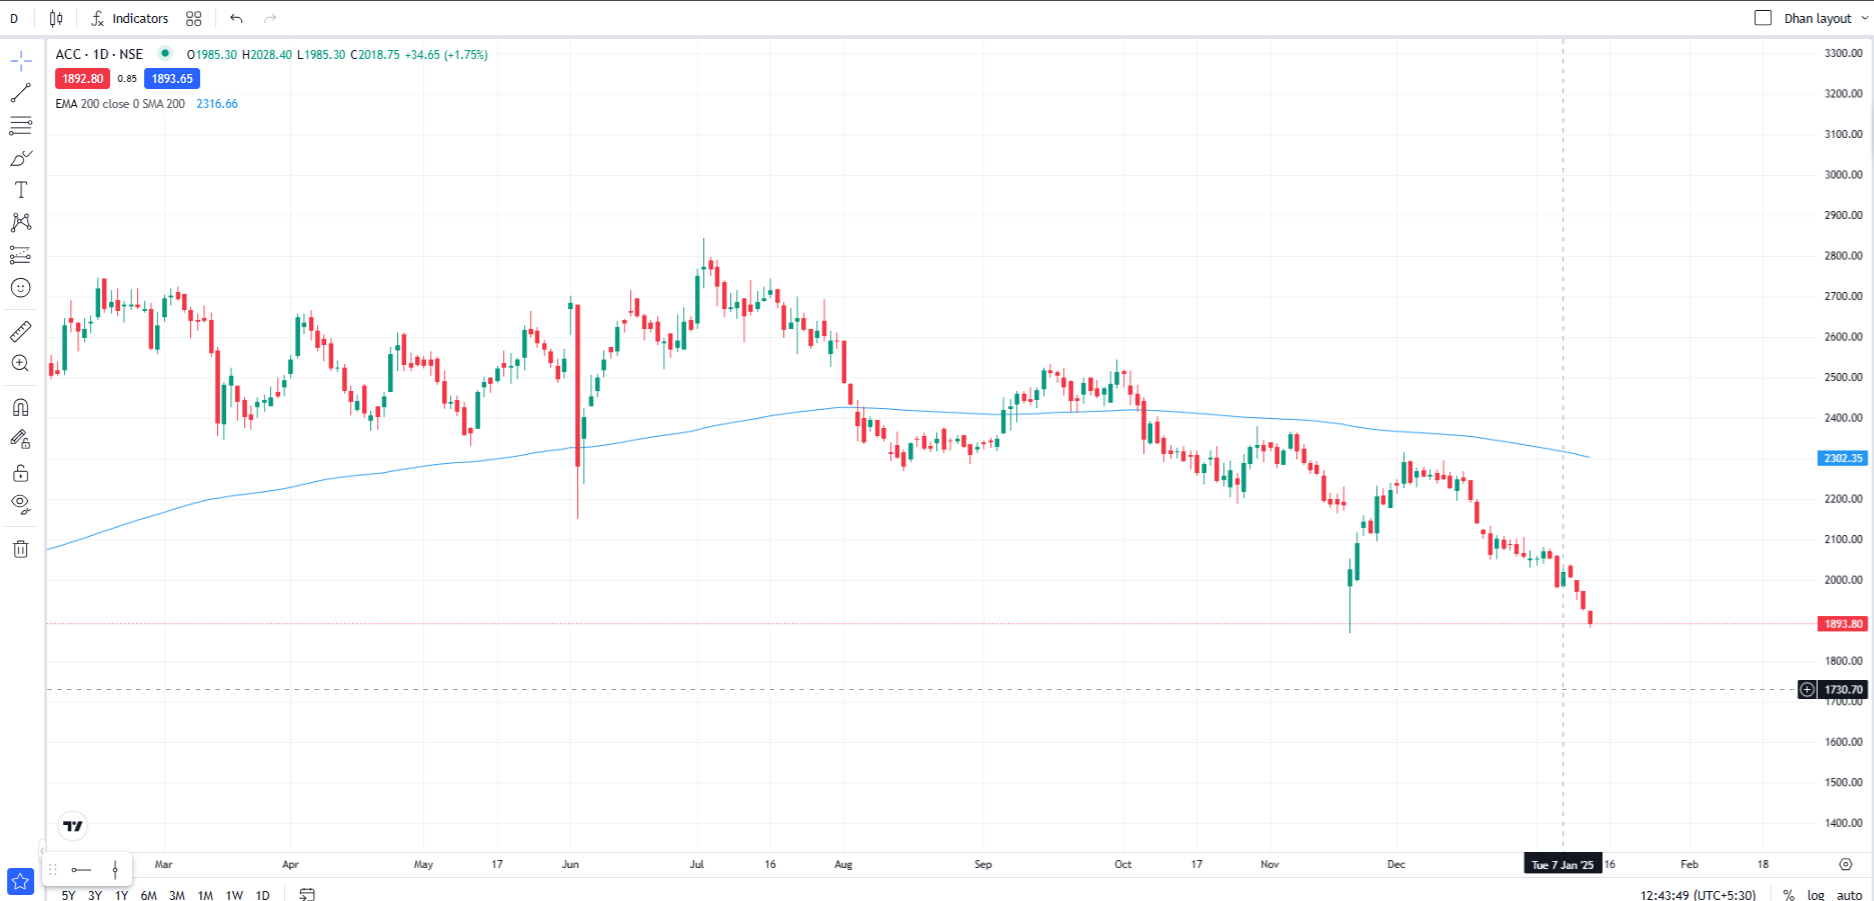
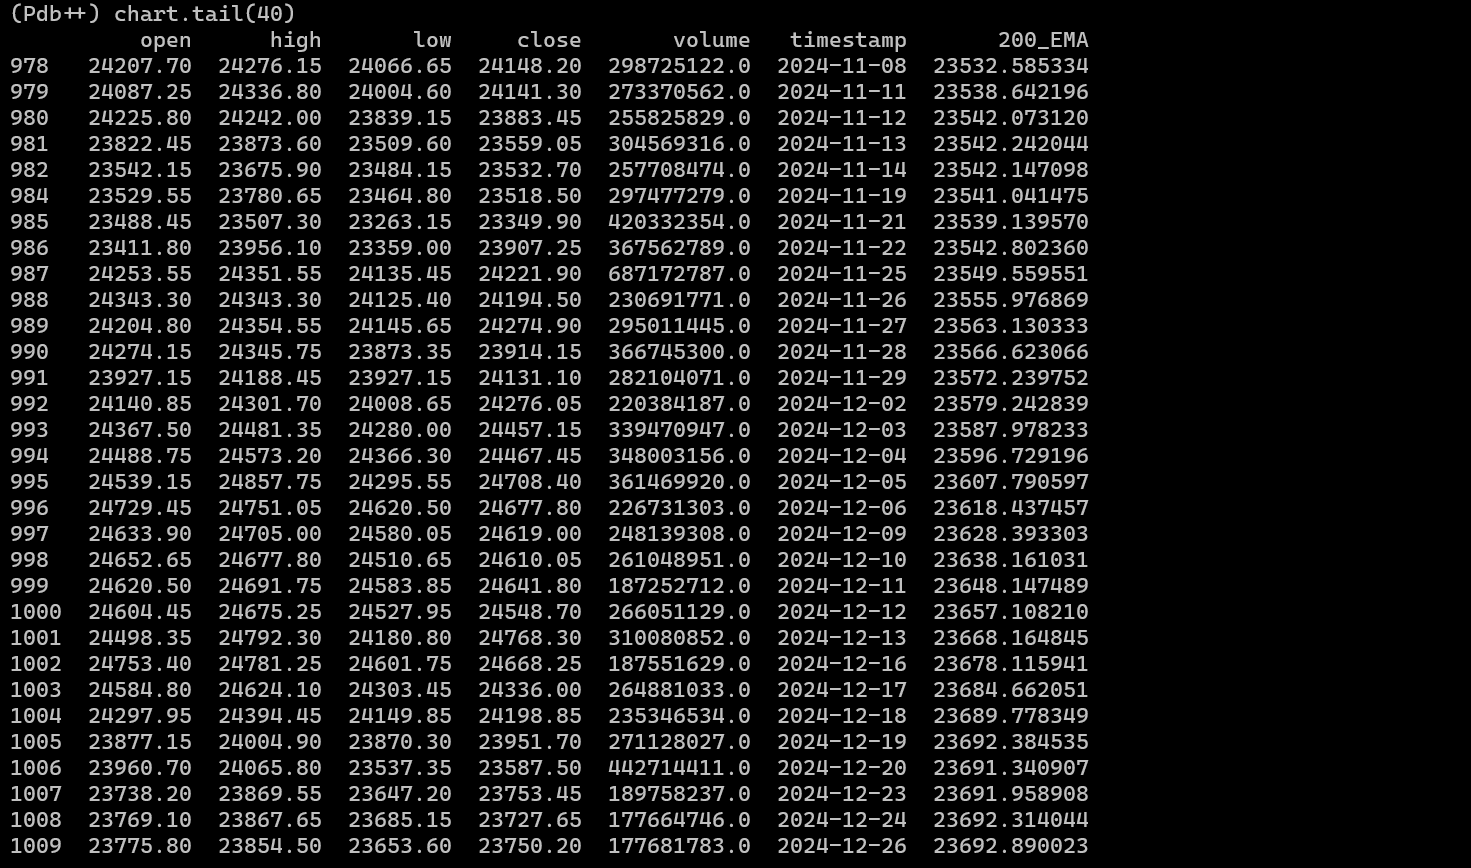
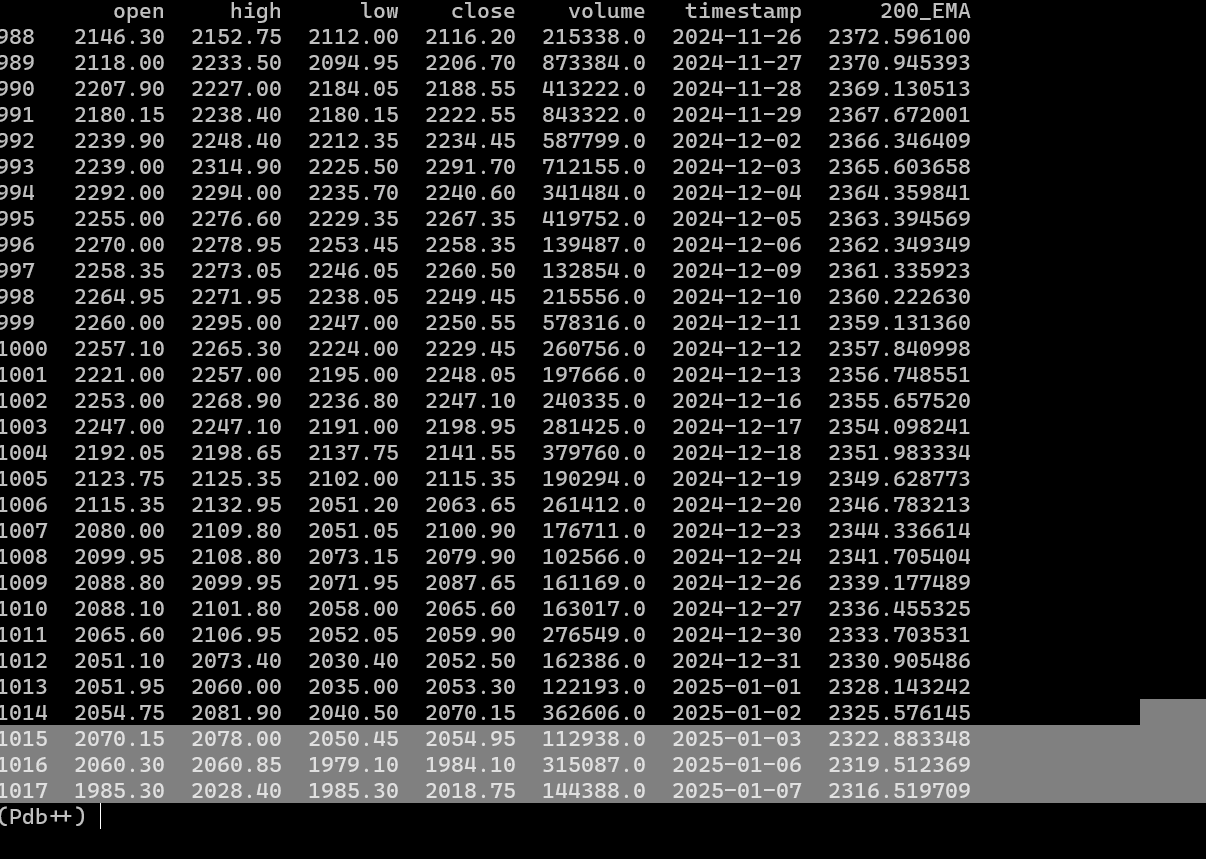
The data is not matching as shown in the picture. The EMA value of the stock is 2313.5. But this value is not displayed anywhere in the data. The code is still not correct.
Hi @Saurabh
Data seems to be matching…
example for 2025-01-07, ema value is 2316.66… which matches with data frame value of 2316.519