Dear Sir,
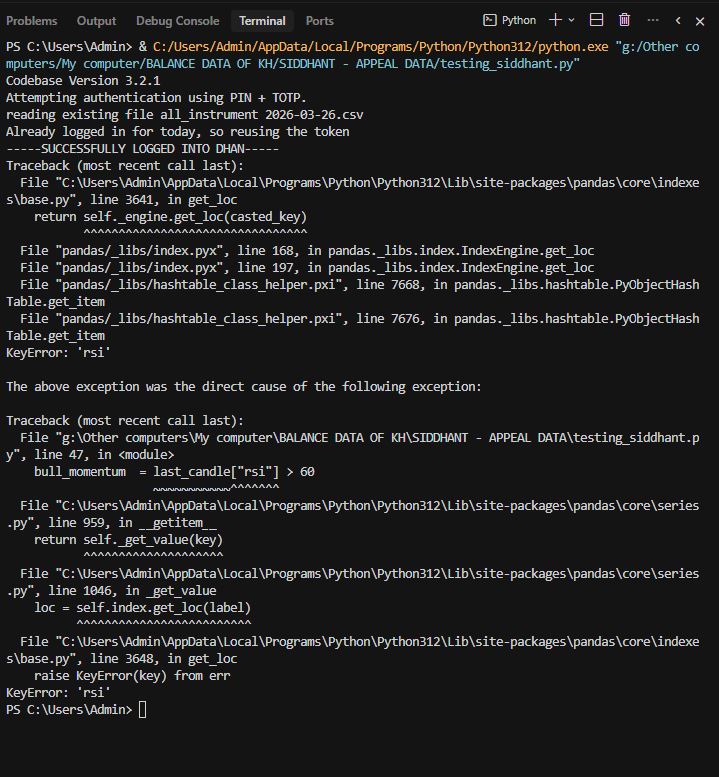
Stuck in between Please guide
from Dhan_Tradehull import Tradehull
from rich import print
import pdb
import talib
import time
import pandas_ta as tacls
import pandas as pd
client_code = "11010721"
pin = "141998"
totp_secret = "LAWG77FHUVYWSXSSI35TMZH5R4Q4R"
tsl = Tradehull(ClientCode=client_code, mode="pin_totp", pin=pin, totp_secret=totp_secret)
#client_code = "1101920721"
#token_id = "eyJ0eXAiOiJKV1QiLCJhbGciOiJIUzUxMiJ9.eyJpc3MiOiJkaGFuIiwicGFydG5lcklkIjoiIiwiZXhwIjoxNzc0NDY1MDY2LCJpYXQiOjE3NzQzNzg2NjYsInRva2VuQ29uc3VtZXJUeXBlIjoiU0VMRiIsIndlYmhvb2tVcmwiOiIiLCJkaGFuQ2xpZW50SWQiOiIxMTAxOTIwNzIxIn0.wJtnNDj0lcXYfh-iMeYhPday8LQ015RK3qJ0A5e8JvEqDoc0GKqxl3uuqMF8Y574T72xoz8upmTYtoIi4QBBHQ"
#tsl = Tradehull(client_code,token_id)
watchlist = ["BAJAJFINSV","RELIANCE","SBILIFE", "LT", "HINDUNILVR", "ADANIENT", "JIOFIN", "BAJAJFINSV", "BAJAJ-AUTO", "KOTAKBANK", "ITC", "EICHERMOT", "TATACONSUM", "TECHM", "ADANIPORTS", "HEROMOTOCO", "INFY", "ASIANPAINT", "HDFCLIFE", "TRENT", "NTPC", "ETERNAL", "AXISBANK", "GRASIM", "ULTRACEMCO", "TITAN", "HCLTECH", "ONGC", "MARUTI", "TCS", "HINDALCO", "DRREDDY", "WIPRO", "CIPLA", "SBIN", "NESTLEIND", "SHRIRAMFIN", "SUNPHARMA", "POWERGRID", "RELIANCE", "JSWSTEEL", "HDFCBANK", "BEL", "COALINDIA", "BHARTIARTL", "INDUSINDBK", "ICICIBANK", "BAJFINANCE", "M&M", "APOLLOHOSP","NIFTY"]
traded_stocks = []
# 3. Calculate Indicators using TA-Lib [6-8]
# Calculate EMA 9 and EMA 20 (Overlap Studies) [6, 9]
for stock in watchlist:
quote = tsl.get_quote_data(names=[stock])
Chart = tsl.get_historical_data(tradingsymbol=stock, exchange='NSE', timeframe="5")
Chart["ema_9"] = talib.EMA(Chart["close"], timeperiod=9)
Chart["ema_20"] = talib.EMA(Chart["close"], timeperiod=20)
last_candle = Chart.iloc[-2]
Chart["rsi"] = talib.RSI(Chart['close'], timeperiod=14) # Calculate RSI (Momentum Indicator) [8, 10]
Chart["adx"] = talib.ADX(Chart['high'], Chart['low'], Chart['close'], timeperiod=14) # Calculate ADX (Momentum Indicator) [7, 10]
# 4. Extract the latest values for the current candle
last_rsi = Chart["rsi"].iloc[-2]
last_ema9 = Chart["ema_9"].iloc[-2]
last_ema20 = Chart["ema_20"].iloc[-2]
last_adx = Chart["adx"].iloc[-2]
trade_3_stocks = len(traded_stocks) < 3
bull_momentum = last_candle["rsi"] > 60
uptrend = last_candle["ema_9"] > last_candle["ema_20"]
speed = last_candle["adx"] > 25
bear_momentum = last_candle["rsi"] < 40
downtrend = last_candle["ema_9"] < last_candle["ema_20"]
speed = last_candle["adx"] > 25
if trade_3_stocks and bull_momentum and uptrend and speed:
print(" buy", stock)
traded_stocks.append(stock)
if trade_3_stocks and bear_momentum and downtrend and speed:
print(" sell", stock)
traded_stocks.append(stock)
print("executing algo", stock)
# 5. Define Strategy Logic
# Condition: RSI > 60 AND EMA 9 > EMA 20 AND ADX > 25
#if latest_rsi > 60 and latest_ema9 > latest_ema20 and latest_adx > 25:
#print(f"SIGNAL FOUND for {symbol}: RSI({latest_rsi:.2f}), EMA9 > EMA20, ADX({latest_adx:.2f})")
# Optional: Place a Market Buy Order if conditions are met [11, 12]
# orderid = tsl.order_placement(symbol, exchange, 1, 0, 0, "MARKET", "BUY", "MIS")
# print(f"Order Placed. ID: {orderid}")
#else:
# print(f"No signal for {symbol}. RSI: {latest_rsi:.2f}, ADX: {latest_adx:.2f}")